

Link Monitoring
Link Monitoring checks the uptime of the landing page links you already use. On a schedule, Integr8 opens each monitored URL, follows the redirects a visitor would follow, and records whether the destination still works.
When to use Link Monitoring
Section titled “When to use Link Monitoring”- Watching the uptime of active offer landing pages that publishers already use
- Catching broken or changed advertiser destinations before traffic stays broken
- Checking a country-specific or device-specific path when that is how real traffic arrives
- Getting email or Slack notice when a monitored landing page stays down
Before you begin
Section titled “Before you begin”- Create an offer with a valid redirect URL on the landing page you want to watch.
- Decide whether checks should run from a specific country or device profile.
- Optional: prepare a Slack incoming webhook URL if you want Slack alerts.
How to access it
Section titled “How to access it”In the sidebar under TOOLS, open Link Monitoring.
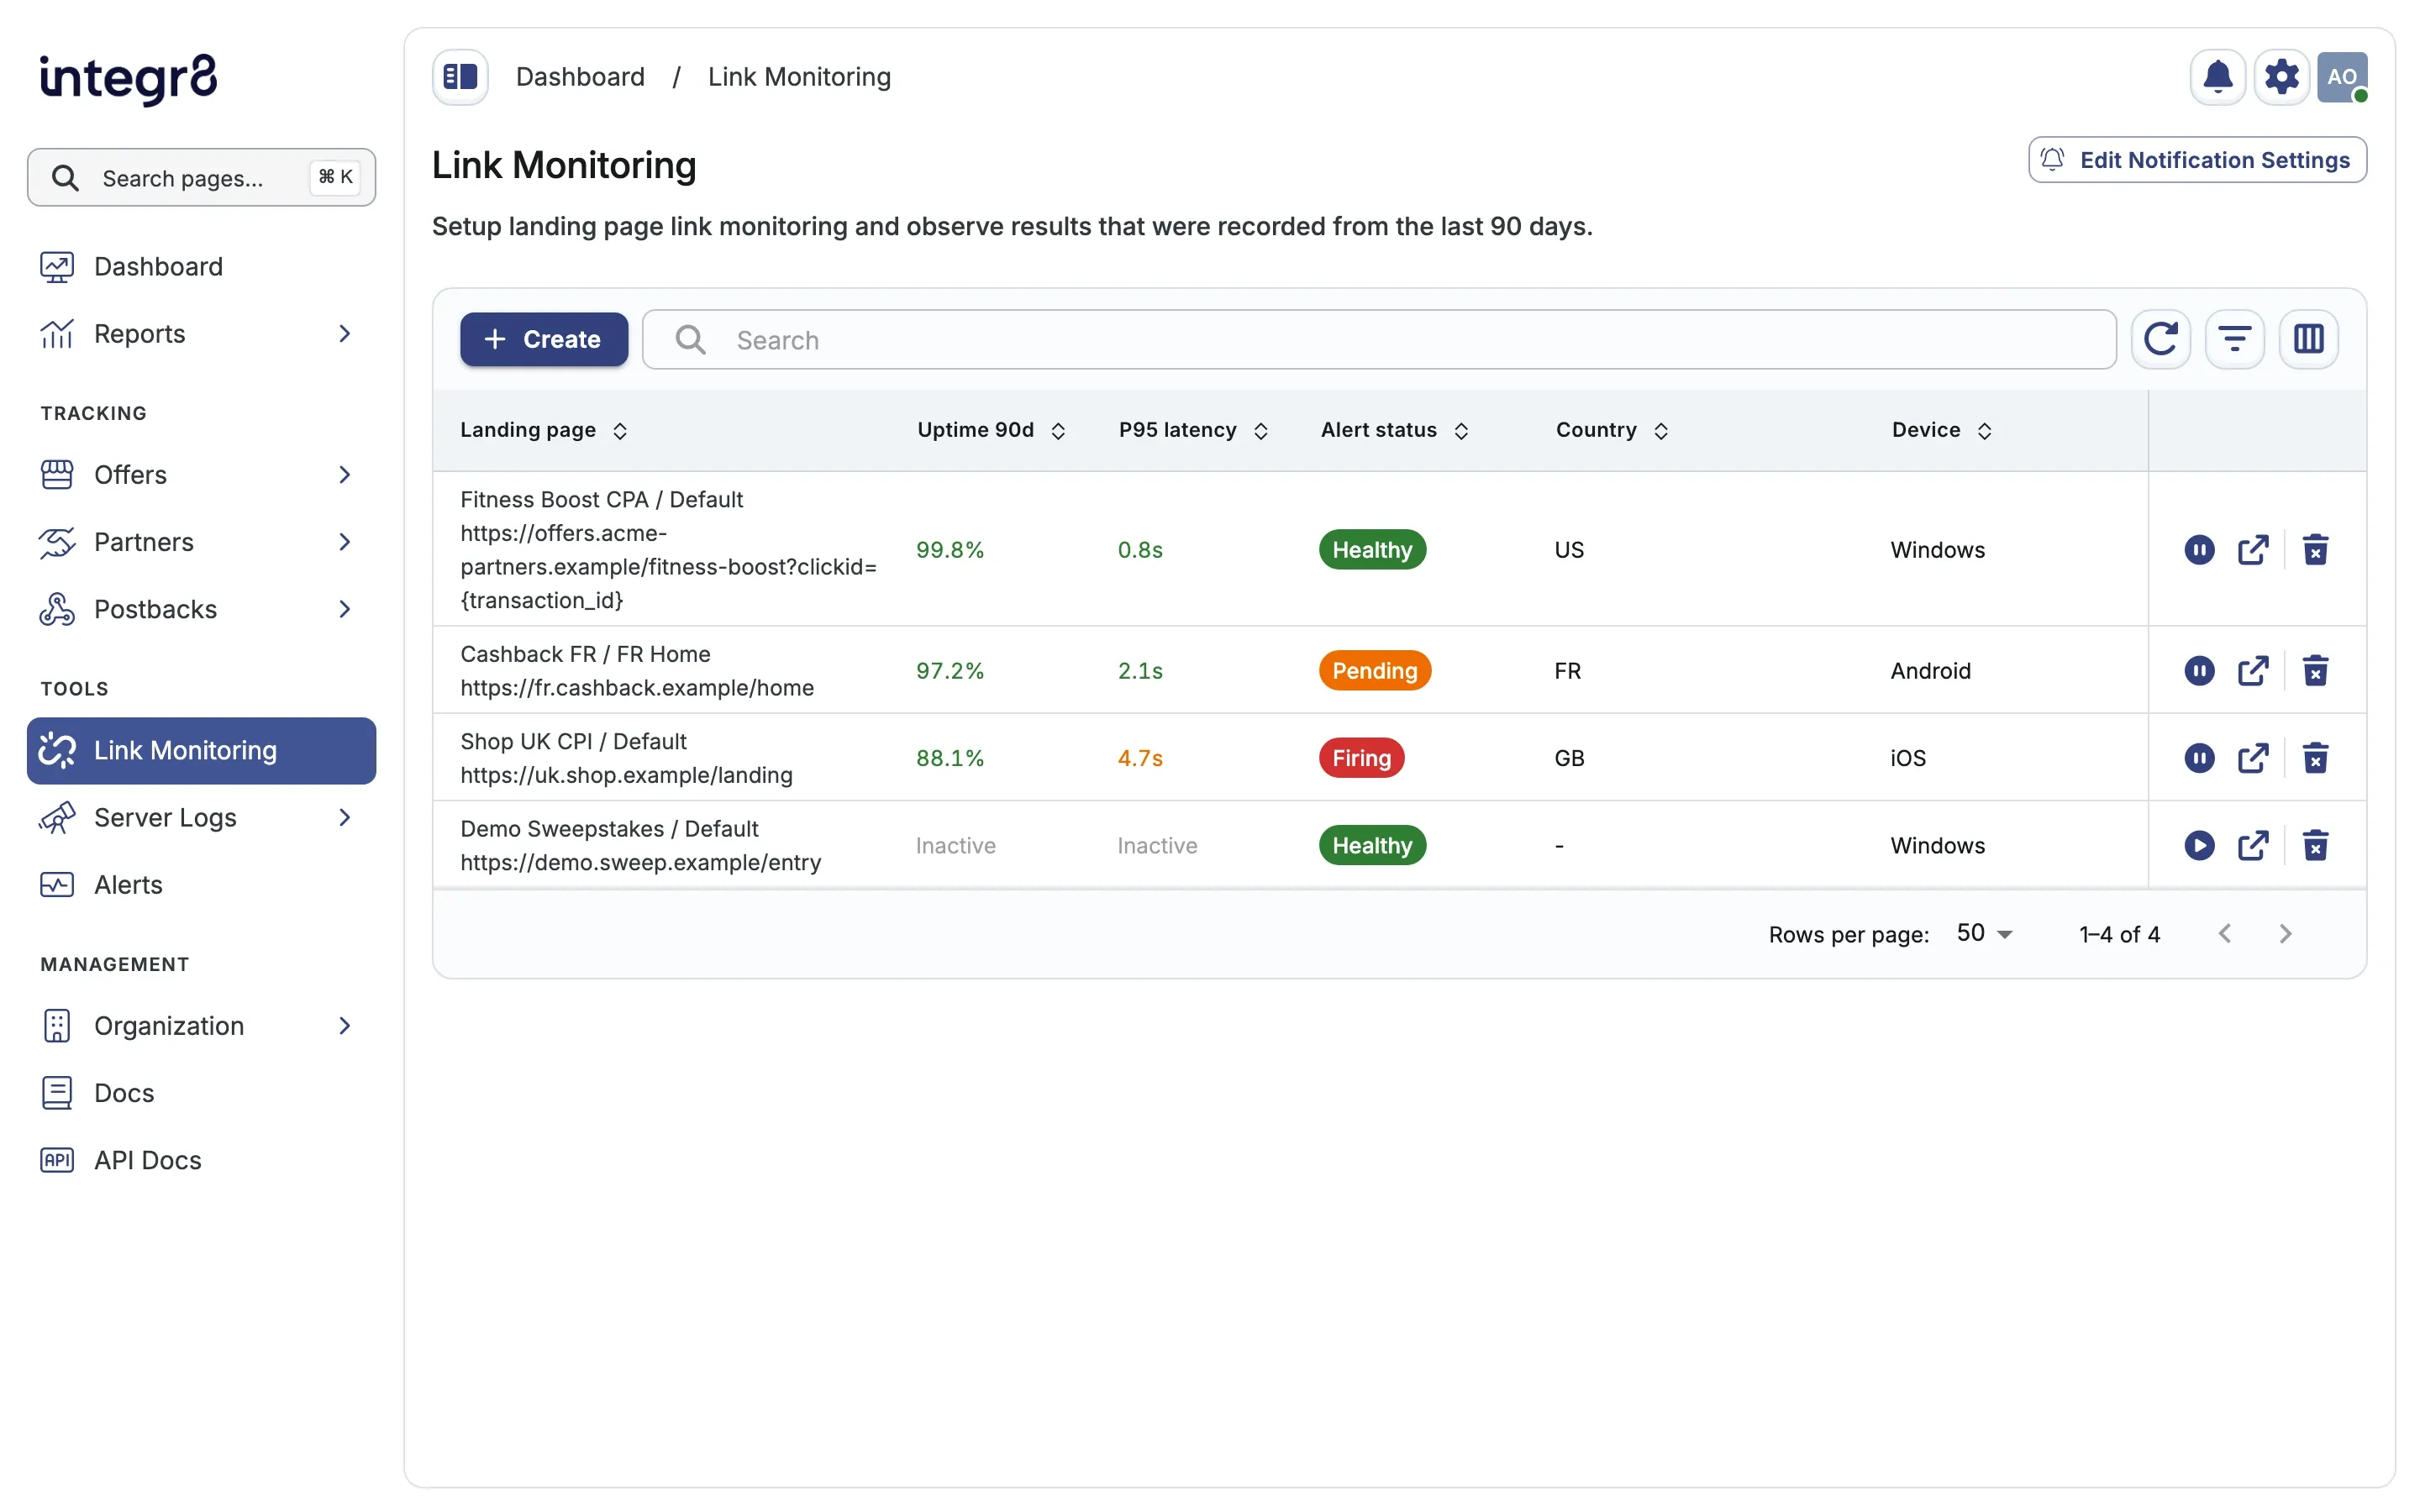
The overview lists every monitor for your integration. Open a row to see that monitor’s detail page (uptime, stats, check history, and settings).
What a check does
Section titled “What a check does”Each monitor uses the landing page redirect URL stored on the offer. Integr8 runs the check with the profile you set (how often, country, device, and timeout), then follows every hop until it reaches a final page or fails.
A check can fail when:
- The destination does not respond in time
- A hop in the redirect path breaks or returns an error
- The final domain is not one of your Expected final domains (if you set any)
Macros in the redirect URL (for example {transaction_id}) stay as written. The check uses the stored URL as-is; it does not fill publisher or click values.
Scheduled checks update alert status. A manual Check Now run still appears in history, but it does not change alert status.
Failure alerts (per monitor) decide whether repeated failures open an incident. Edit Notification Settings (organization-wide) decide who gets email or Slack when those incidents fire or recover.
Create a monitor
Section titled “Create a monitor”- Open Link Monitoring in the sidebar under TOOLS.
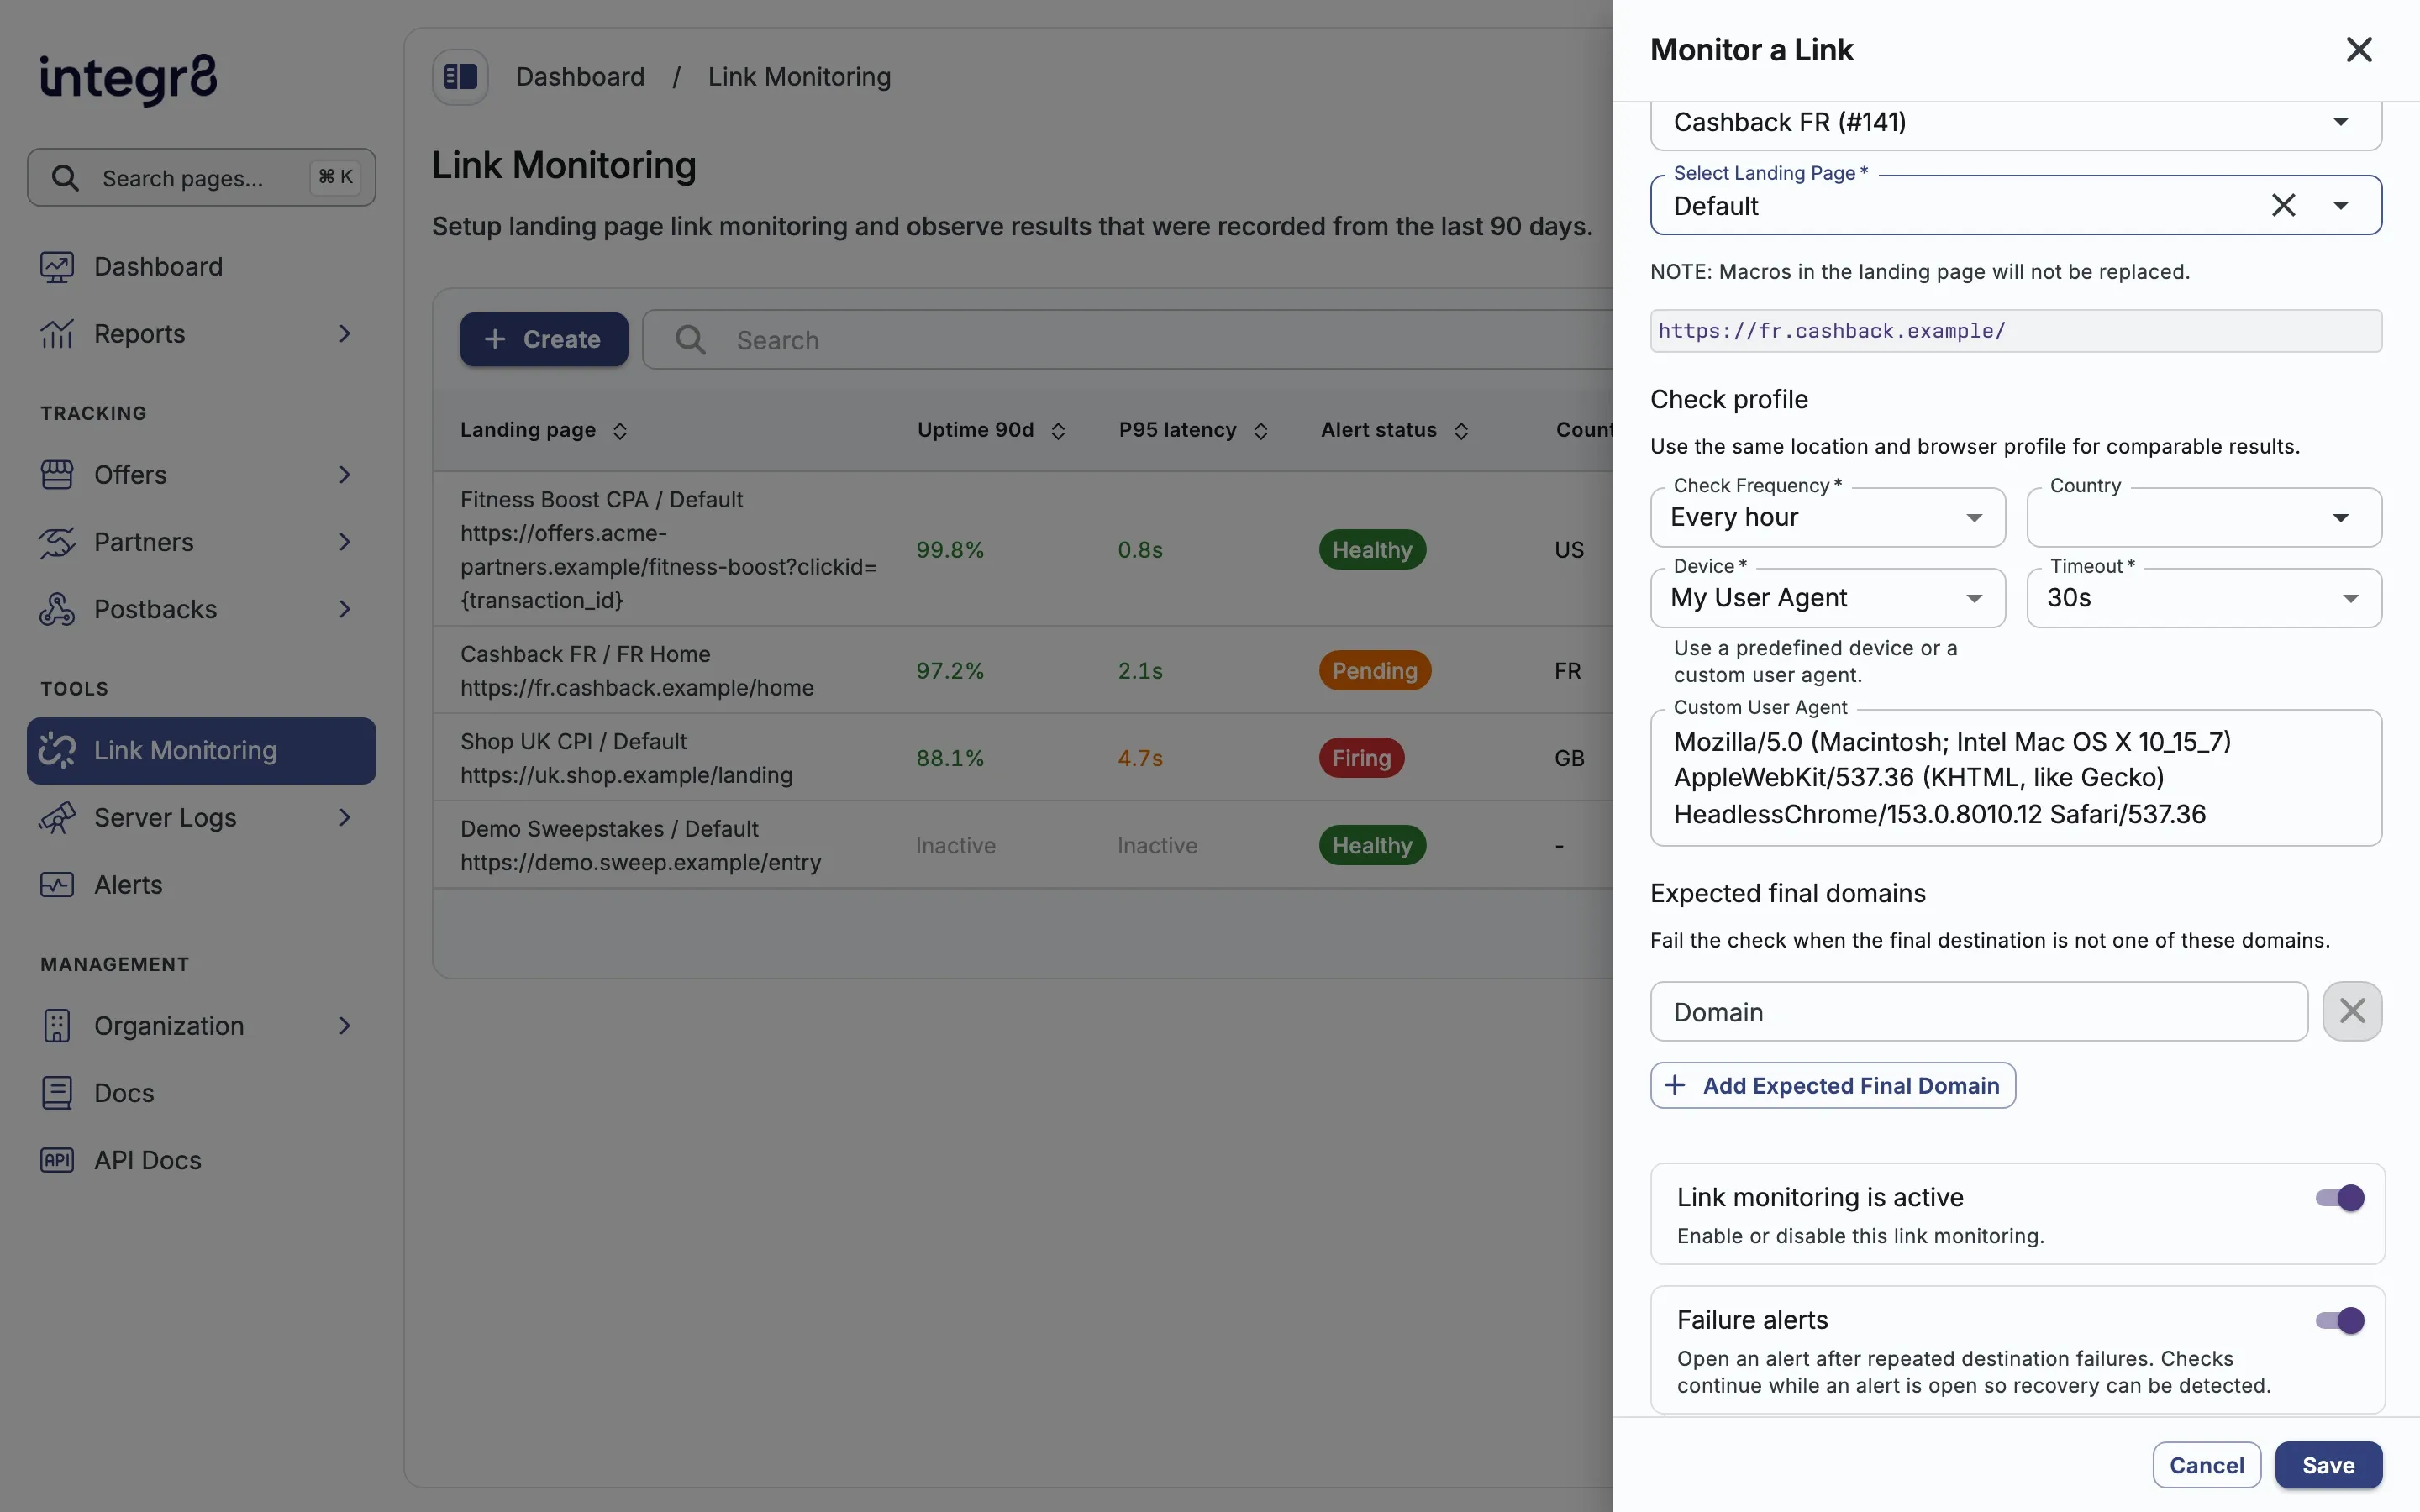
- Click Create to open Monitor a Link.
- Under Select page to monitor:
- Choose the offer in Select Offer
- Choose the landing page in Select Landing Page
- Review the redirect URL shown under the selectors.
- Configure the Check profile:
- Check Frequency: every 5 minutes, every 15 minutes, or every hour
- Country (optional): run the check as if from that country
- Device: a predefined device, your current browser, or a custom user agent
- Timeout: 10s, 15s, or 30s
- Optional: add Expected final domains. If you add any, the check fails when the final destination is not on that list.
- Leave Link monitoring is active on unless you want to create the monitor paused.
- Optional: turn on Failure alerts and set Alert after consecutive failures (default is 2).
- Click Save.
After you save an active monitor, scheduled checks start on the frequency you chose. Each offer landing page can have only one monitor. Landing pages that already have a monitor are marked as already monitored in the selector.
Manage monitors on the overview
Section titled “Manage monitors on the overview”From the Link Monitoring overview you can:
- Search and filter the table
- Open a monitor by clicking its landing page cell or choosing Open
- Activate or Deactivate a monitor from the row actions
- Delete a monitor (prefer deactivate if you might need it again)
Default overview columns:
| Column | Description |
|---|---|
| Landing page | Offer and landing page name, plus the redirect URL |
| Uptime 90d | Share of successful checks over the last 90 days |
| P95 latency | How long the slower successful checks took over the last 90 days |
| Alert status | Current alert state from scheduled checks |
| Country | Country used for the check, if set |
| Device | Device or browser profile used for the check |
| Max Hop | How many redirects the check will follow before stopping |
| Timeout | How long the check waits before failing |
| Actions | Activate or deactivate, open, or delete |
Inactive monitors show Inactive instead of uptime and latency values.
Monitor detail
Section titled “Monitor detail”Open a monitor to review recent health and history.
Status and actions
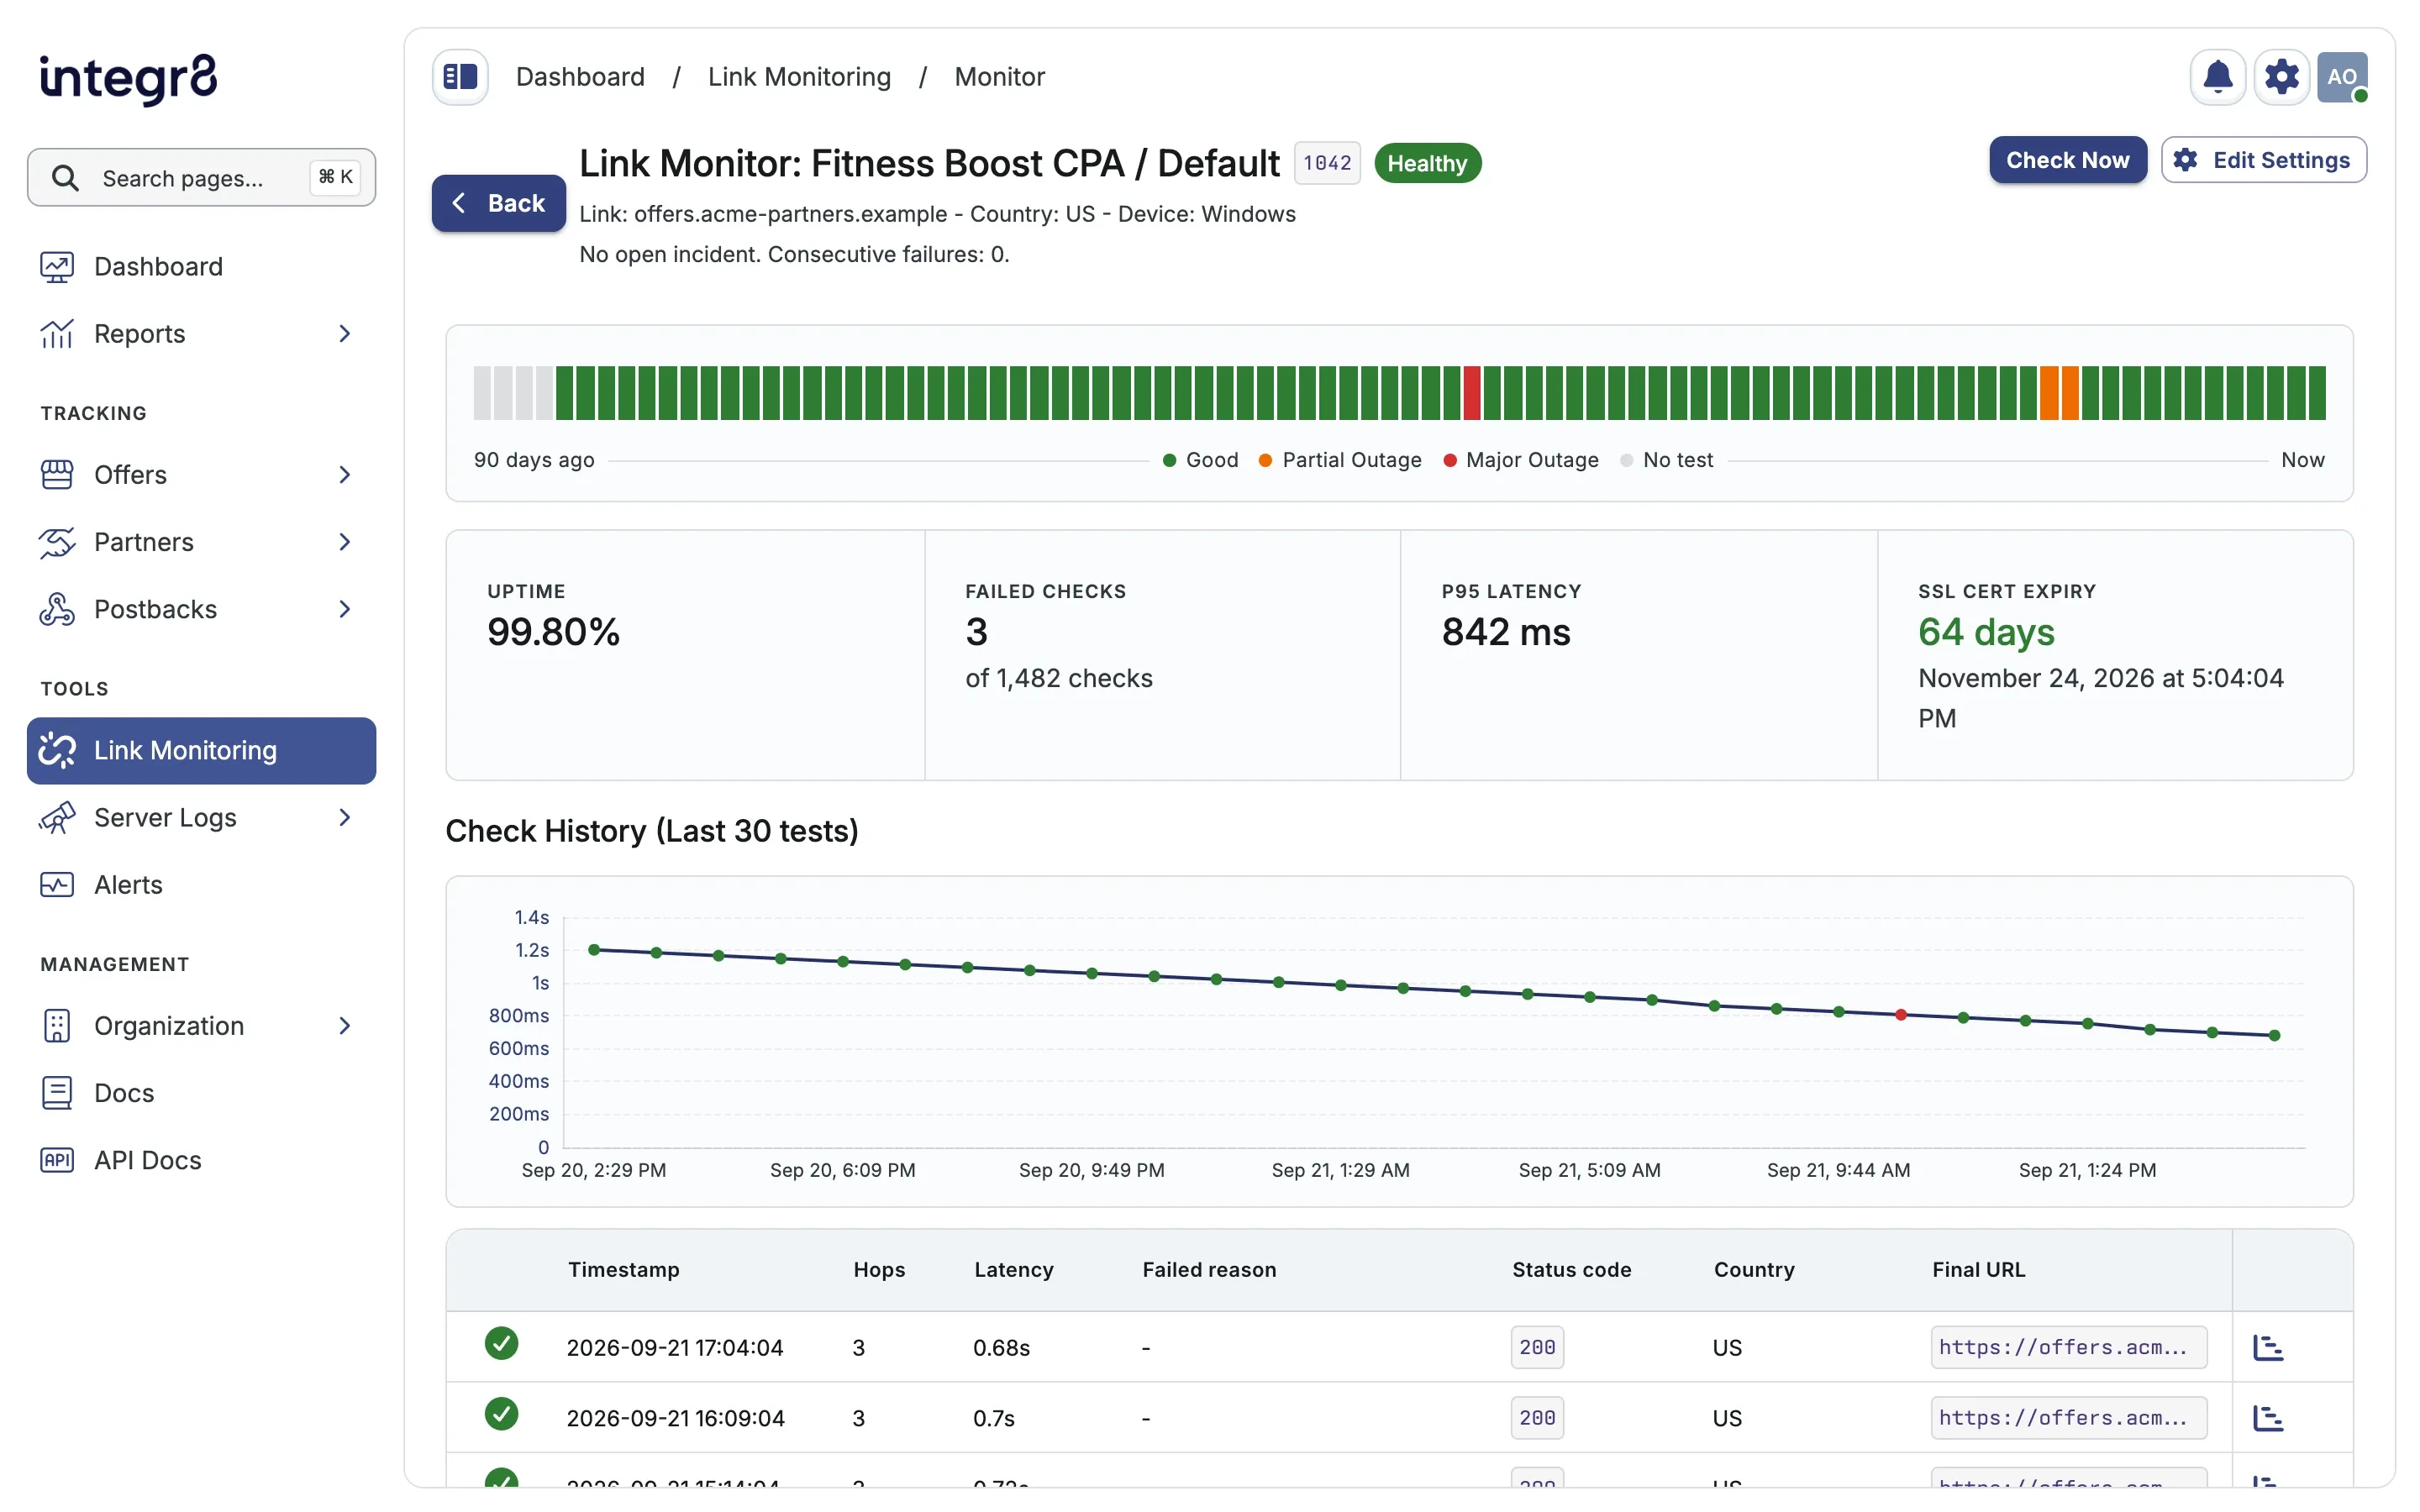
Section titled “Status and actions”The header shows the offer and landing page, alert status, and a short status description. From here you can:
- Click Check Now to run one on-demand check
- Click Edit Settings to change the check profile, expected domains, active state, or failure alerts
Uptime and stats
Section titled “Uptime and stats”The detail page shows:
| Panel | What it means |
|---|---|
| 90-day uptime bar | Daily health for the last 90 days: Good, Partial Outage, Major Outage, or No test |
| Uptime | Overall uptime percentage for the last 90 days |
| Failed checks | How many completed checks failed in that window |
| P95 latency | How long the slower successful checks took |
| SSL Cert expiry | Days left on the destination security certificate, when available |
Check history
Section titled “Check history”Check History (Last 30 tests) lists recent results with timestamp, hops, latency, failed reason, status code, country, final URL, and user agent.
Click View redirect chain on a row to inspect each hop in the redirect path.
When a monitor fails
Section titled “When a monitor fails”- Open the monitor detail page.
- Review Check History for the failed reason, final URL, and status code.
- Open View redirect chain on a failed row to see which hop broke.
- Fix the landing page redirect URL (or the advertiser destination) on the offer.
- Wait for the next scheduled checks. To leave Firing or Recovering, Integr8 needs two consecutive successful scheduled checks before status returns to Healthy.
If the link is still broken, you can Deactivate the monitor temporarily. That stops scheduled checks and new alert noise without deleting the monitor or wiping its other settings. Turn it back on when the destination is fixed.
Use Check Now to confirm a fix in history right away. Manual checks do not clear alert status; only scheduled successes do.
Alert status
Section titled “Alert status”Alert status updates from scheduled checks only. Manual Check Now runs never change it.
| Status | Meaning |
|---|---|
| Healthy | No open incident |
| Pending | Failures observed, still below your Alert after consecutive failures threshold |
| Firing | Incident open; the consecutive-failure threshold was reached |
| Recovering | Incident still open; waiting for a second consecutive successful scheduled check before returning to Healthy |
From Pending, one successful scheduled check returns the monitor to Healthy. From Firing, the first success moves it to Recovering, and a second consecutive success returns it to Healthy. A failure while Recovering moves it back to Firing.
Turn Failure alerts off on a monitor if you want history without opening incidents for that landing page.
Notification settings
Section titled “Notification settings”Notifications are organization-wide for Link Monitoring. They are not configured per monitor. Per-monitor Failure alerts still control whether an incident opens.
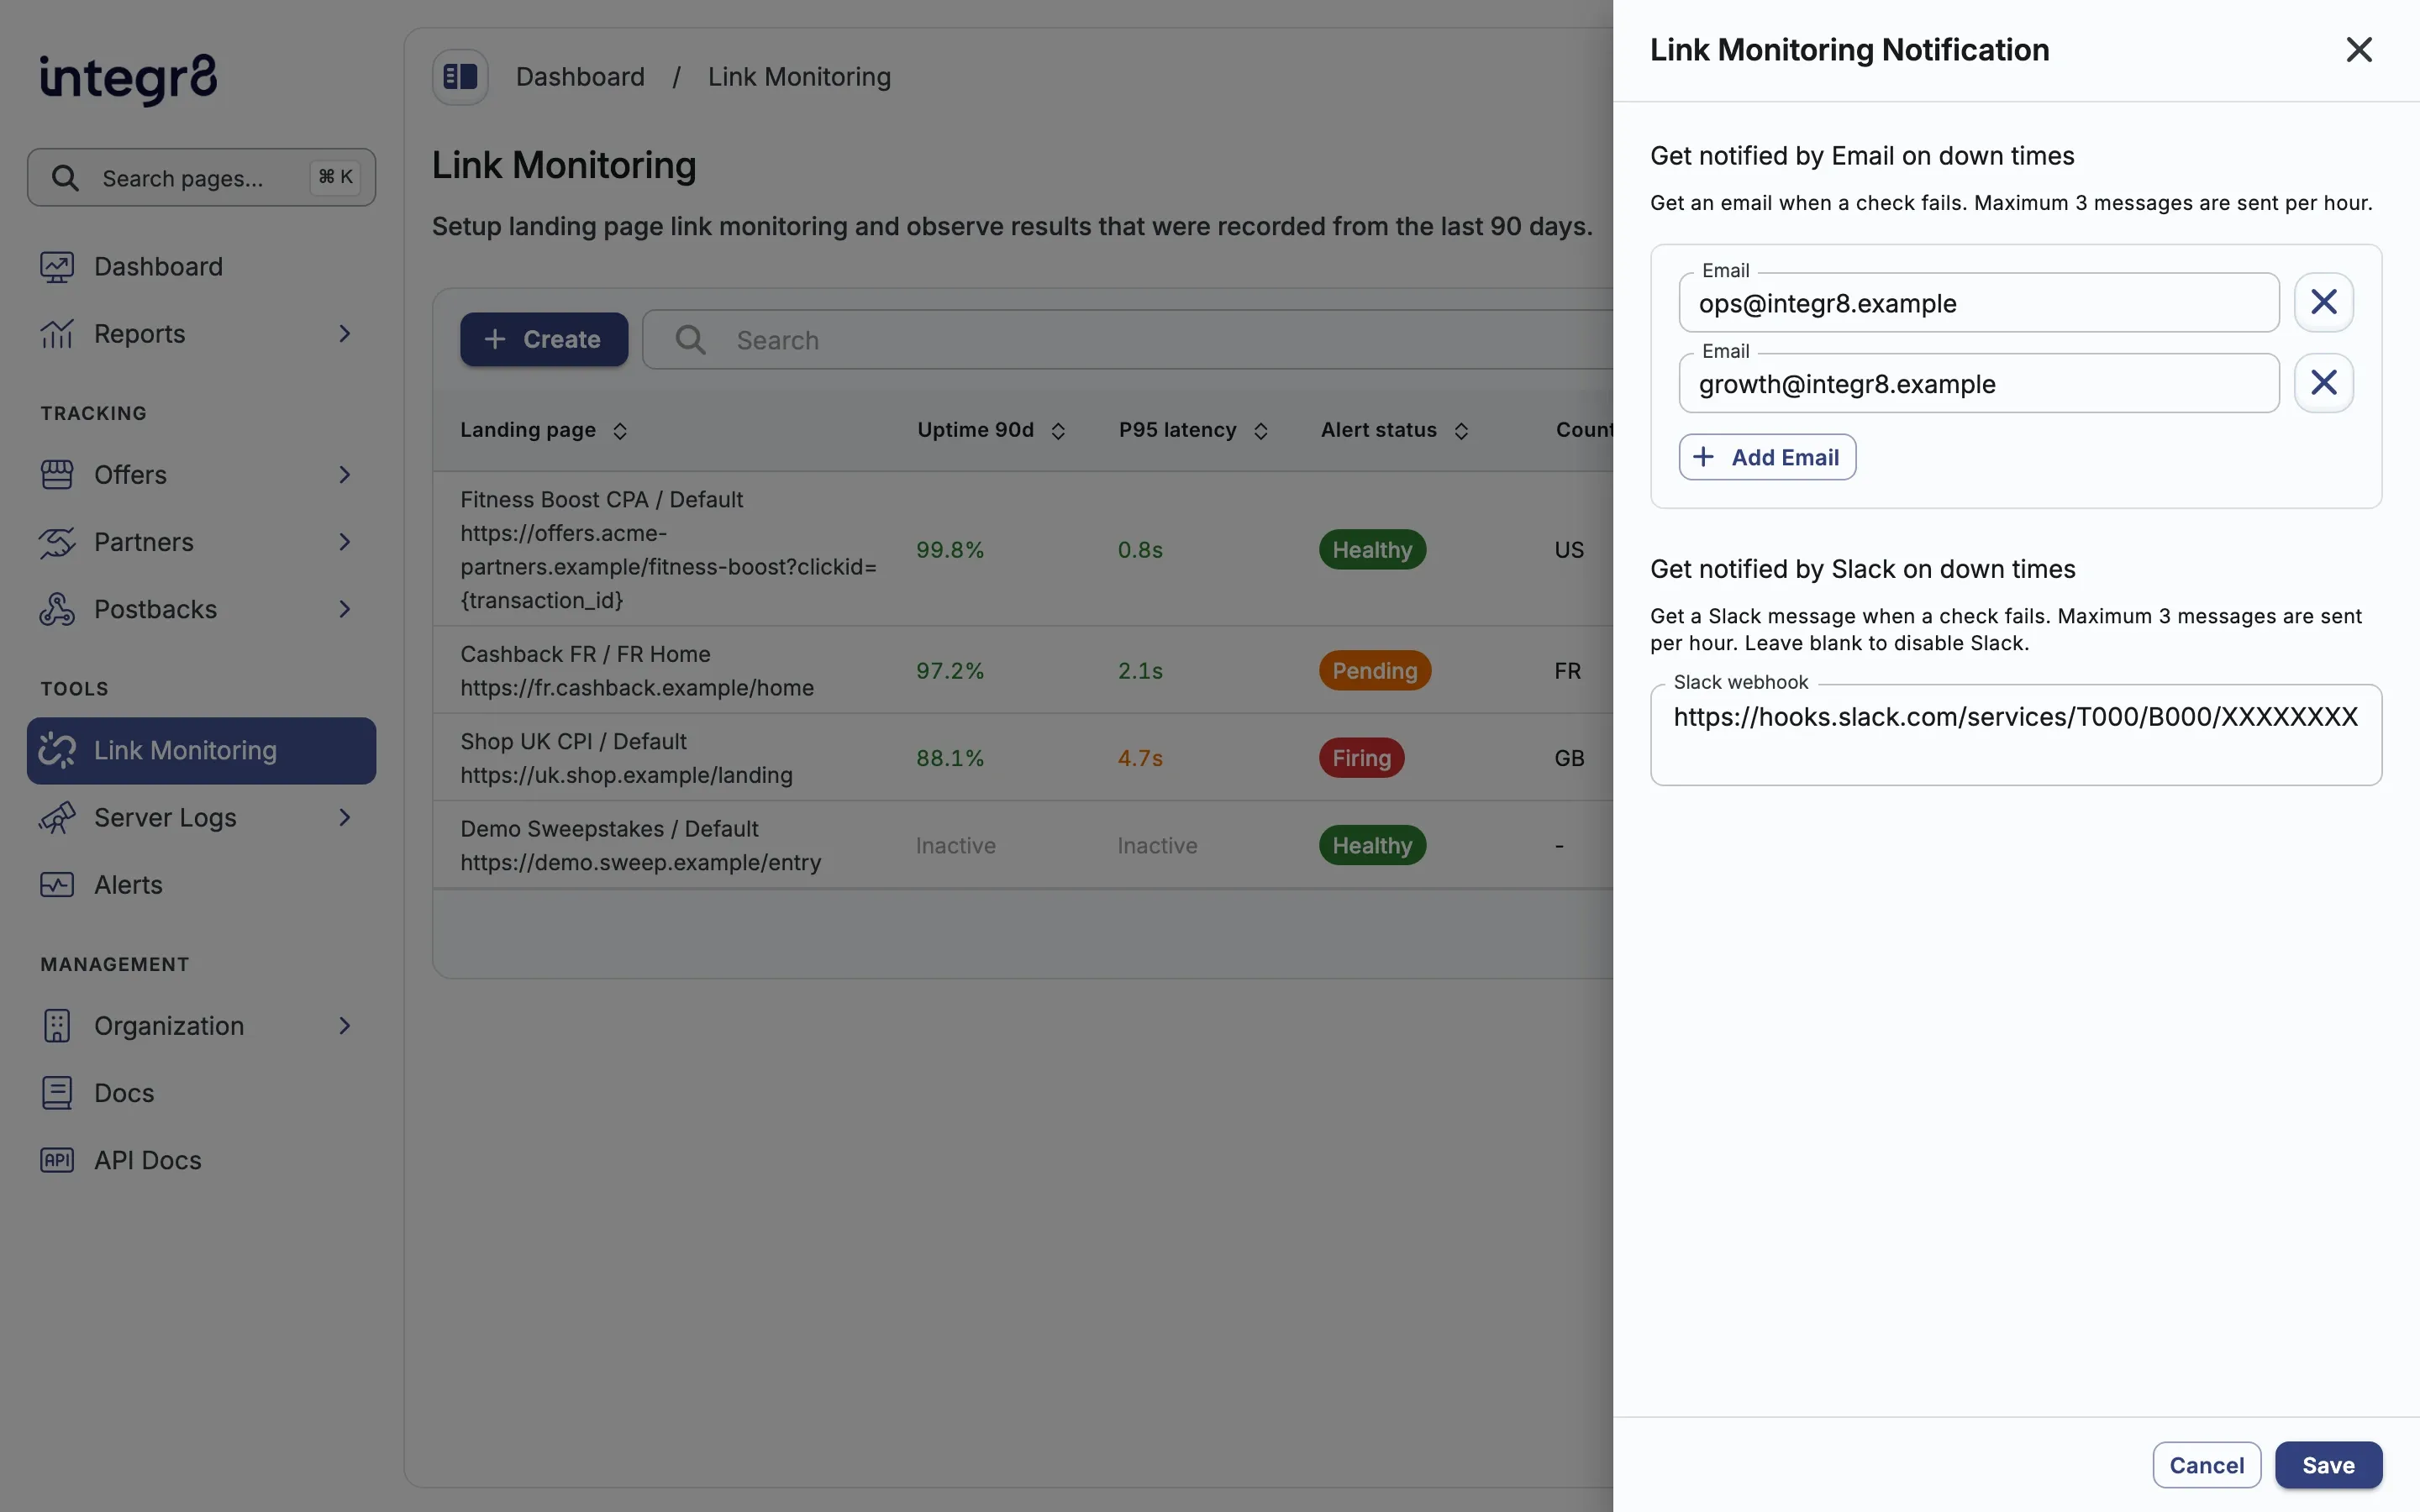
- On Link Monitoring, click Edit Notification Settings.
- Add one or more Email addresses under email downtime notifications.
- Optional: paste a Slack webhook URL. Leave it blank to turn Slack off.
- Click Save.
Email and Slack each send at most three downtime messages per hour.
Field reference
Section titled “Field reference”| Field | Required | Description |
|---|---|---|
| Select Offer | Yes | Offer that owns the landing page |
| Select Landing Page | Yes | Default or additional landing page to monitor |
| Check Frequency | Yes | How often scheduled checks run |
| Country | No | Country for the check; leave empty to skip |
| Device | Yes | Device or browser profile used for the check |
| Custom User Agent | Sometimes | Required when you choose a custom user agent |
| Timeout | Yes | How long the check waits before failing |
| Expected final domains | No | Allowed final domains; empty skips this rule |
| Link monitoring is active | Yes | Inactive monitors are not scheduled |
| Failure alerts | No | Opens an incident after repeated destination failures |
| Alert after consecutive failures | When alerts are on | How many scheduled failures in a row open an incident (1 to 100) |
Next steps
Section titled “Next steps”- Landing pages: add or update the destination URL you want to monitor
- Tracking links: confirm publishers are using the correct offer and landing page link